The Belvedere Case Study
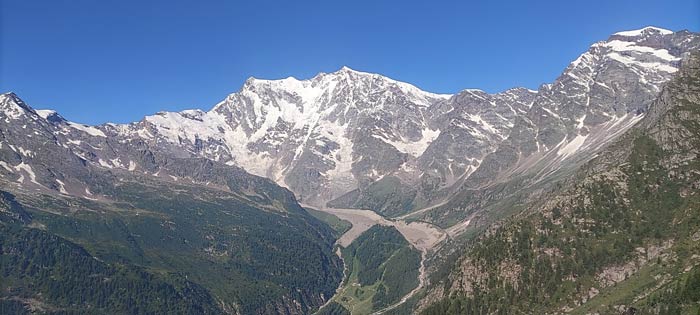
The Belvedere Glacier, situated in Valle Anzasca at the base of Monte Rosa, is one of the most extensively studied debris-covered glaciers in the Alps. Unlike clean ice glaciers, its surface is concealed by a layer of rocks and sediments, which protects the underlying ice but complicates the task of monitoring its evolution.
Understanding changes in debris-covered glaciers is critical for climate models, hydrology, and hazard prevention. These environments are dynamic, unstable, and subject to rapid seasonal or structural changes. For this reason, accurate and repeatable 3D data is essential to document their evolution over time.
In the summer of 2024 and 2025, a survey campaign was conducted during the annual Summer School organised by LabMGF at Politecnico di Milano [1], with Stonex providing technical sponsorship. The objective was to evaluate the potential of UAV-mounted SLAM LiDAR for glacier monitoring, producing high-resolution datasets safely and efficiently.
In this scenario, different approaches are being tested: Politecnico focused on photogrammetry [2], installing two stereo cameras at the glacier terminus and performing a UAV photogrammetric survey of the tongue. Stonex, on the other hand, carried out UAV-based LiDAR acquisitions.
The Challenge of Surveying a Debris-Covered Glacier
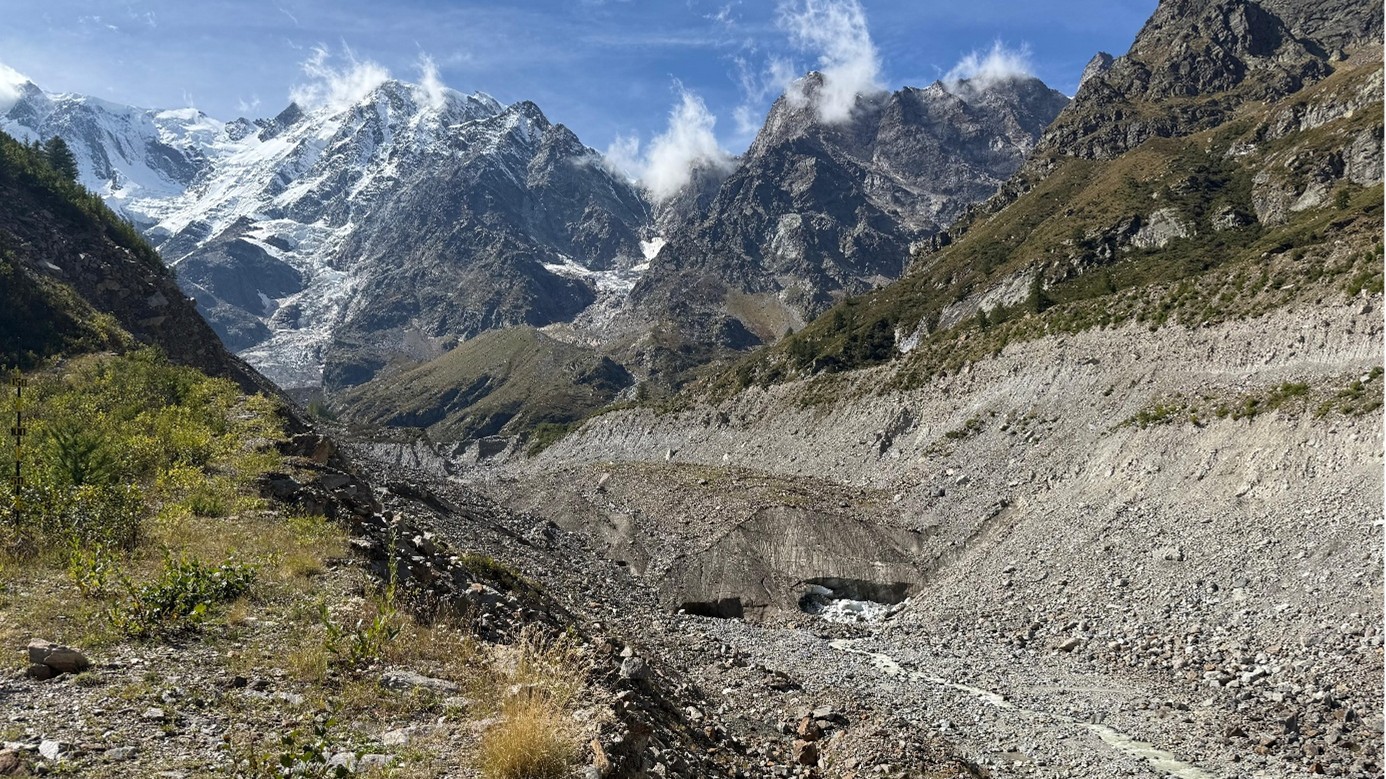
Surveying glaciers is not a simple task. Steep slopes, crevasses, and unstable moraines make ground surveys dangerous, while the rock and sediment debris covering the ice complicates the detection of surface changes.
Seasonal variability adds another layer of complexity and can reshape the glacier within weeks. These conditions highlight the need for a survey method that is fast, safe, precise, and above all repeatable — so that changes can be tracked reliably from one year to the next, but also between seasons.
From UAV Flight to 3D Deliverables
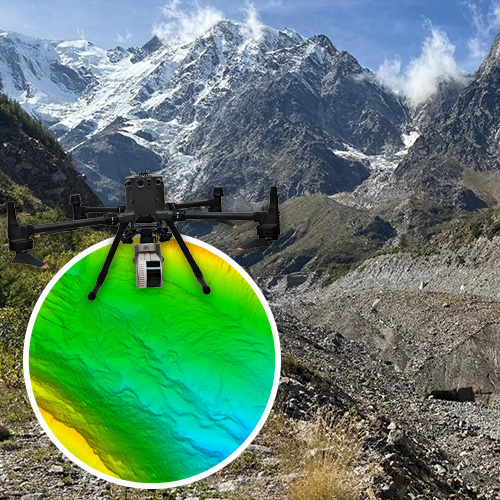
The survey focused on the Northern tongue of the glacier and was carried out with the Stonex X200GO SLAM scanner mounted on a UAV.
The scanner was synchronized through the GOapp, while the UAV was piloted remotely via radio controller. The entire acquisition of the glacier tongue was completed in just twenty minutes.
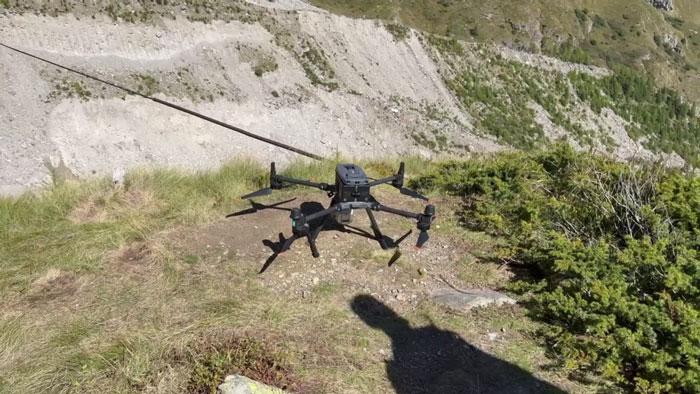
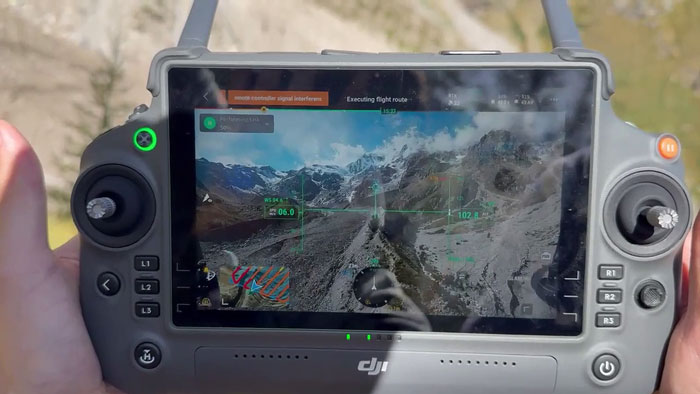
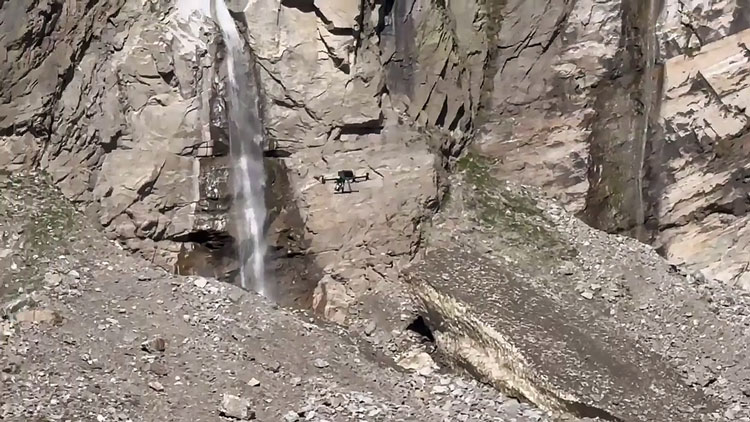
UAV flight operation during survey, Stonex
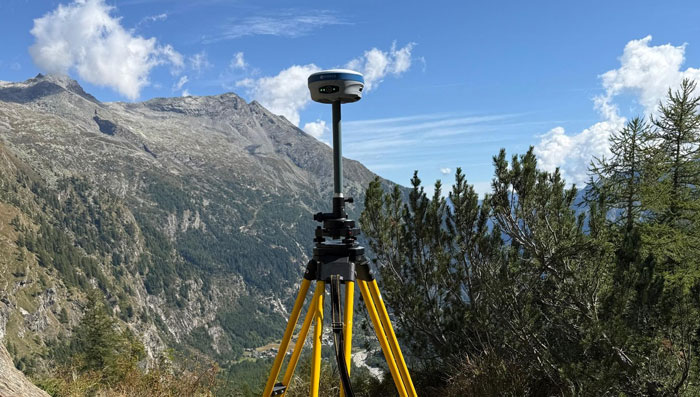
To guarantee accurate orientation, a local base station (Stonex S900+) was installed on a known point for georeferencing. The base sent the corrections directly to the radio controller via local NTRIP, then the radio controller sent it to the drone and consequently to the scanner.
Once the raw data was collected, it was processed through a two-step workflow:
- GOpost was used to reconstruct the SLAM trajectory, filter noise, optimize the point cloud, apply orientation, and generate colourization.
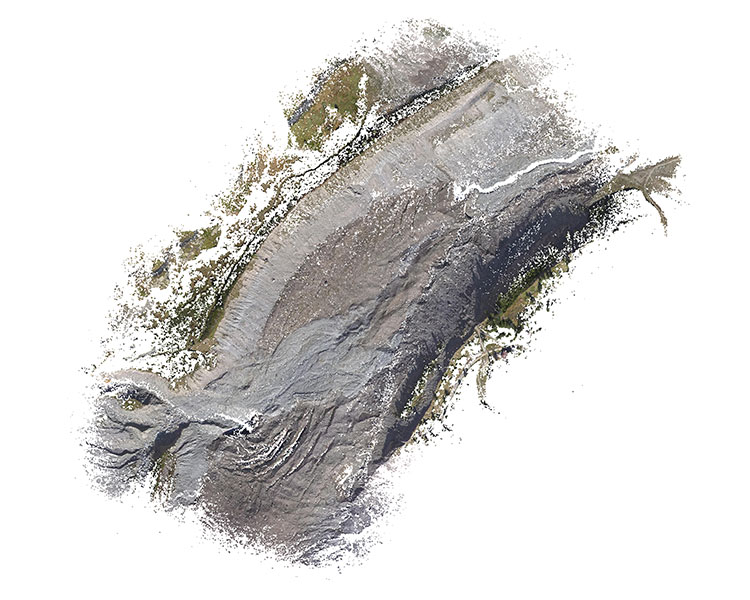
- Cube-3D was then used for the analysis of the point cloud and comparison with data from previous year. The results include a dense and accurately georeferenced point cloud of the glacier tongue and surrounding moraines. From this dataset it was possible to produce Digital Terrain Models, contour lines, and cross-sectional profiles, as well as to calculate volumetric differences between surveys.
2024–2025 Monitoring Insights
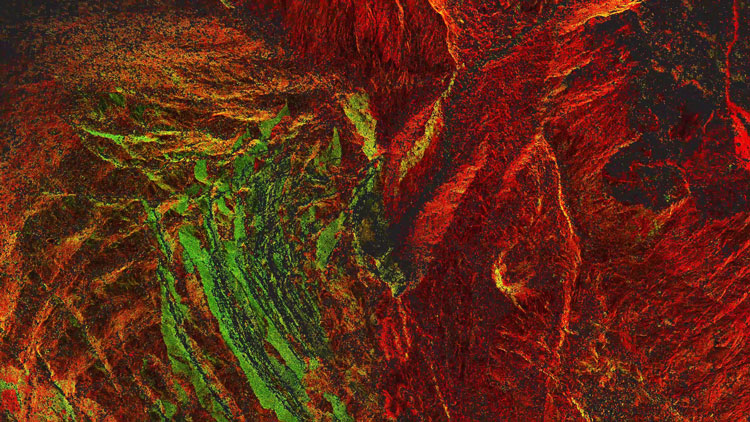
In 2024, a landslide broke the structure of the glacier tongue, detaching the final portion from the upper part of the glacier. In the point cloud of that year, black zones appear where the laser didn’t return.
This happened because water absorbs the LiDAR signal, meaning that a free surface stream was flowing over the ice. That stream removed the debris cover and exposed bare ice.
In 2025, those same areas appeared more covered again. Yet LiDAR intensity values made it possible to highlight cracks and previously exposed ice zones, the latter would be very difficult to identify with photogrammetry, since dust and debris often give the ice a uniform brown or grey appearance.
Studies have highlighted that ice covered by a thin layer of dust and debris has a higher melting rate than bare ice, or ice covered by a thick debris layer, because of the lower albedo [3].
The point cloud can be classified to extract a Digital Terrain Model (DTM). The DTM is the base for further analysis, such as contour lines calculation, profiles extraction and volume loss estimation.
The transverse profiles show differences of up to 20 meters in elevation between 2024 and 2025 for the terminal part, while in the upper part, water flowing from the channel created by the landslide is excavating a tunnel, with differences up to 40 m.
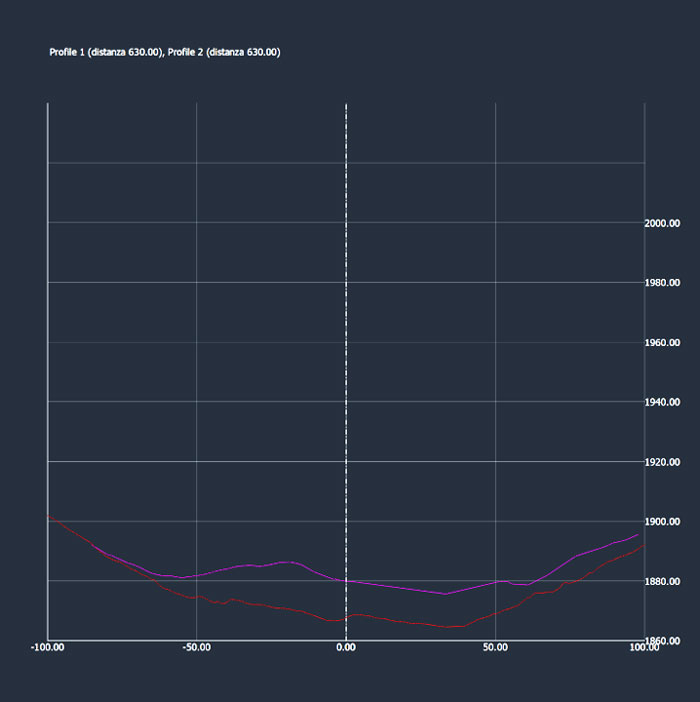
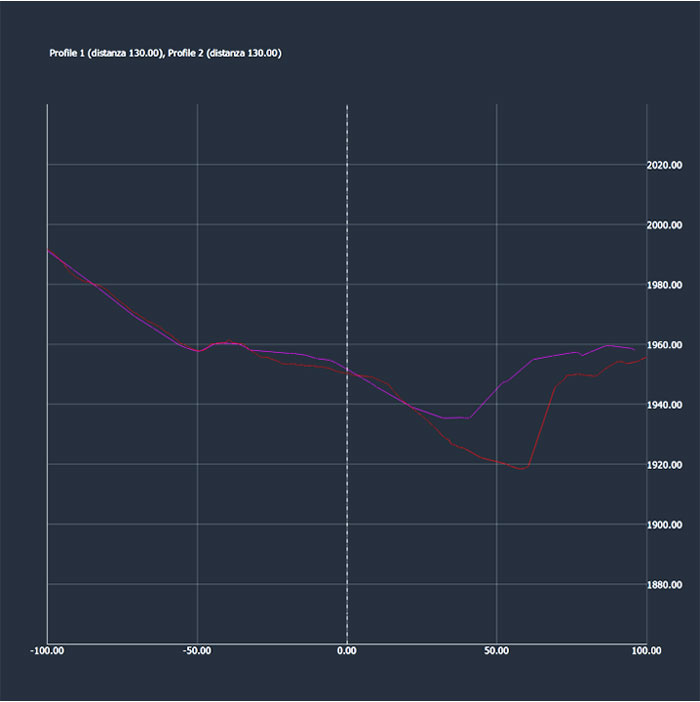
Transverse profiles of the glacier, Stonex
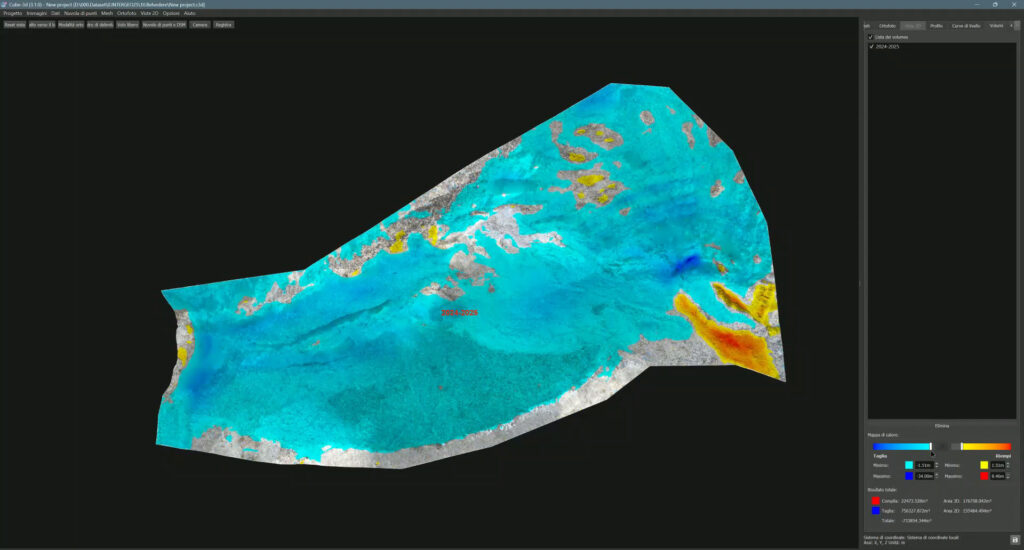
The volume comparison makes the ice loss strikingly visible: over this single year, the surveyed northern tongue alone lost about 780,000 cubic meters of ice. Higher differences are visible in areas compatible with the findings of the profiles analysis.
It is important to underline that this analysis focuses only on a portion of the glacier, while it extends much further as a whole, with a southern tongue and a main body, which terminates under the Monte Rosa eastern wall. Based on estimates from previous years, the total annual ice loss of Belvedere Glacier is in the order of a few million cubic meters — between 2 and 5 million cubic meters per year over the last decade.
Applications and Broader Impact
The outcomes of this project extend far beyond the case study itself. For the scientific community, the datasets provide a robust foundation for 4D monitoring of glacier dynamics, supporting climate and hydrology studies. For local authorities and hazard managers, they enable the identification of cracks, crevasses, and thinning zones, helping to assess risks that could threaten the village of Macugnaga downstream. For students, the survey was a valuable opportunity to gain hands-on experience with cutting-edge UAV-based LiDAR technology during the Summer School.
Finally, the project contributes to long-term monitoring networks active since 2015 with Politecnico di Milano and Politecnico di Torino. The data is shared through open-access visualization platforms such as Potree [https://thebelvedereglacier.it/potree – 4], ensuring transparency, accessibility, and collaboration.
Bibliography & Websites
[1] Gaspari, F., Ioli, F., Barbieri, F., Bonora, S., Fascia, R., Pinto, L., and Migliaccio, F.: Bridging geomatics theory to real-world applications in alpine surveys through an innovative summer school teaching program, Int. Arch. Photogramm. Remote Sens. Spatial Inf. Sci., 2024, XLVIII-4/W12-2024, 59–66, https://doi.org/10.5194/isprs-archives-XLVIII-4-W12-2024-59-2024
[2] Ioli, F., Dematteis, N., Giordan, D., Nex, F., and Pinto, L. Deep Learning Low-cost Photogrammetry for 4D Short-term Glacier Dynamics Monitoring. PFG – Journal of Photogrammetry, Remote Sensing and Geoinformation Science, 2024. https://doi.org/10.1007/s41064-023-00272-w
[3] Naegeli, K., and Huss, M.: Sensitivity of mountain glacier mass balance to changes in bare-ice albedo, Ann. Glaciol., 2017, 58(75 Pt 2), 119–129, https://doi.org/10.1017/aog.2017.25